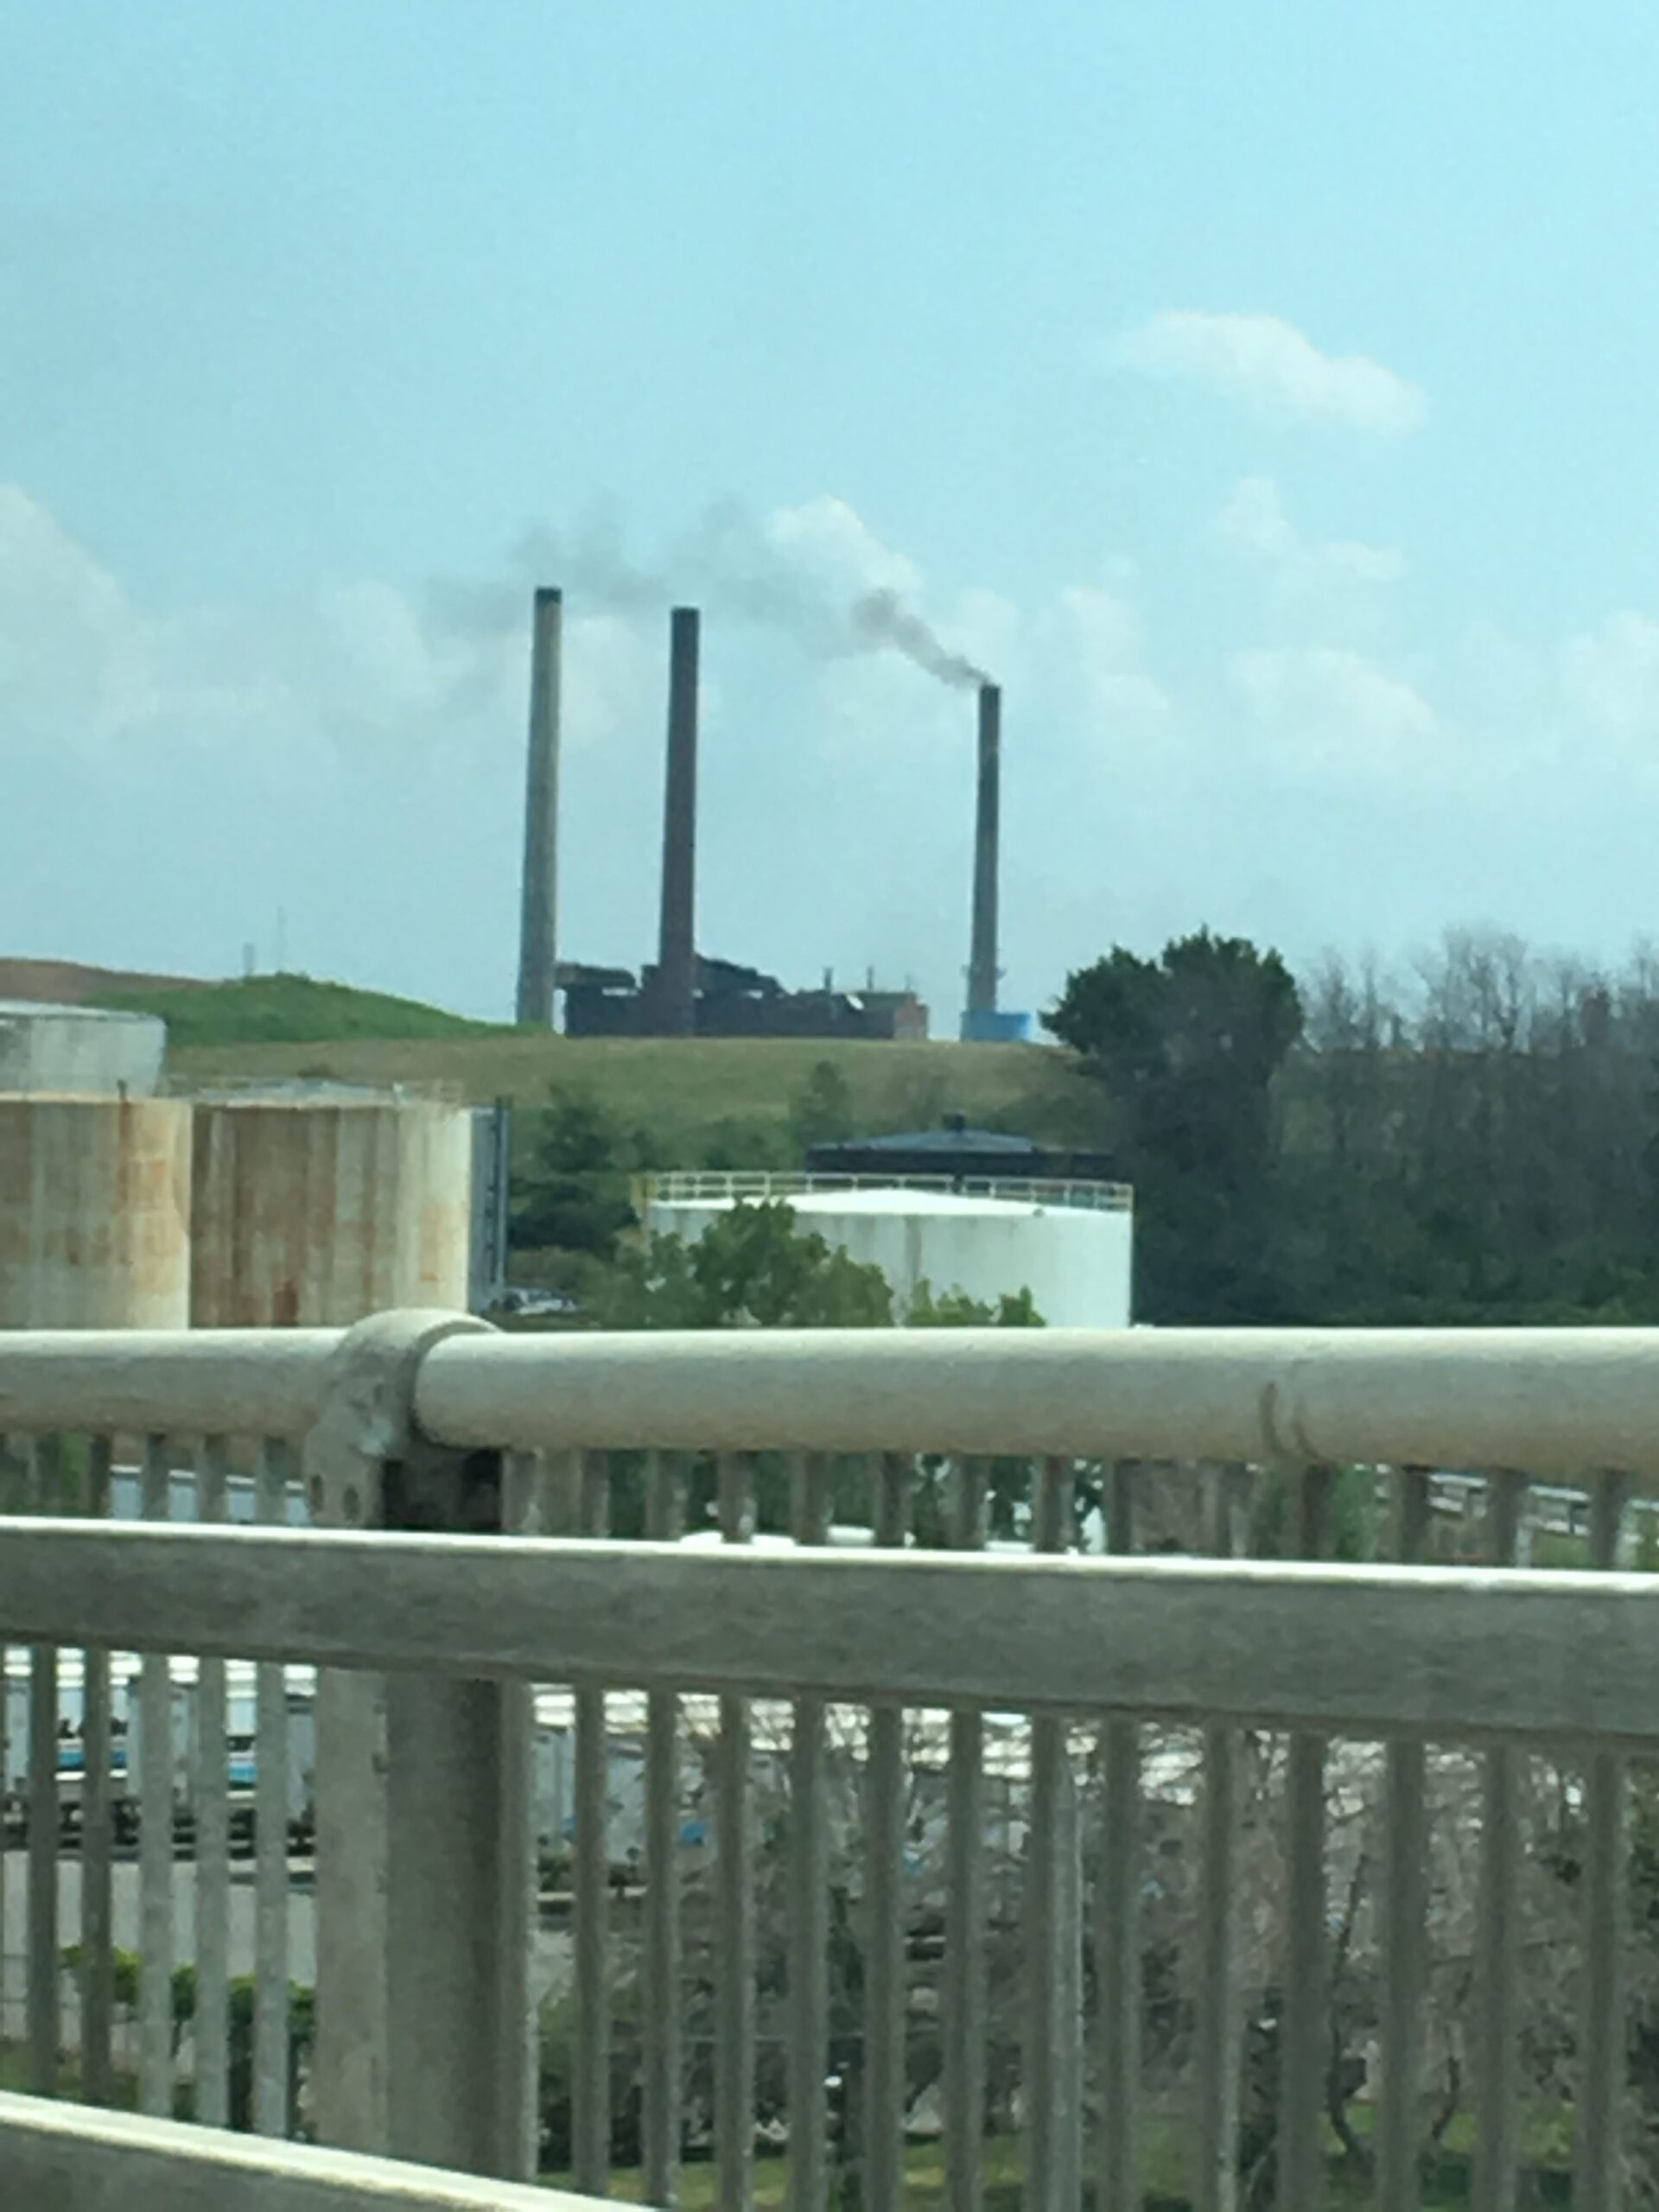
In 2014, the Tonawanda Coke Corporation in Tonawanda, New York was criminally prosecuted for violations of the Clean Air Act. Court ordered additional remediation, pollution controls, and community service fines ensued, with a substantial decrease in related pollutants, such as benzene. Media reports of a recent partial tunnel collapse were made public in May of 2018. This collapse may have affected the factory’s compliance with emission permits and standards. Residents reported considerable increases in the opacity from the emissions of one of the factory smokestacks during this time to a cross-section of leaders, including local and state civic leaders, community environmental and organizing groups, researchers, environmental protection agencies, healthcare providers, faith groups and social medic communities. Figure 1 is a picture of the facility taken on July 15, 2018 at 2:51 pm.
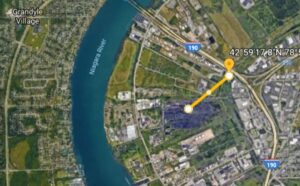
Community-initiated requests for assistance with actionable objective data and exposure assessment ensued. Fortunately, the Department of Environmental Conservation Air Quality Monitoring network includes a stationary monitor within 800 meters of the factory to the Northeast, consistent with the direction of prevailing winds (Figure 2). However, the only pollutant that can be downloaded in real-time from this monitor is particulate matter with a median aerodynamic diameter of less than 2.5 μm (PM 2.5). Particulate matter is one potential proxy for measuring the visual opacity noted, though it is not specific to coke oven emissions which require addressing a much more specific complex mixture of toxics, including polycyclic aromatic hydrocarbons (particularly volatile organic compounds). The remaining pollutant data collected at the stationary monitor, which are relevant to the measurement of coke oven emissions, goes through a process of internal quality control and certification before they are publicly available through the Environmental Protection Agency’s Air Quality System. Pragmatically, this process means these additional air pollutant data may not be available until May of 2019. While some well-resourced and engaged residents had access to personal and indoor air quality monitors, this technology was not available to all who might be exposed to the emissions.
Figure 2. Google Earth Screenshot of Distance between Smokestack and Ambient Monitor
The purpose of this brief report is to relay a methods example of how the publicly available data can be used as an initial screening method. This process provides a timely step to empowering community capacity with data-driven approaches to environmental exposure concerns.
In this example, hourly data was downloaded from the Grand Island Boulevard monitor at the New York State Department of Environmental Conservation’s site http://www.nyaqinow.net/. Forty-eight hours of hourly data was used for the weekend dates of July 14-15, 2018. Wind direction was collected from timeanddate.com and manually double-entered. Wind direction was recorded at 6 minutes before the hour and linked to the proceeding hour’s particulate matter measurement. These datasets are preliminary and require future validation. The dates were chosen in response to reports of odors and visual emissions by neighboring residents on social media, completion of nearby highway construction, and recent heat advisory and air quality alert days with low wind speed. The weekend days were also chosen to limit the potential measurement of nearby rush hour motor vehicle traffic on the adjacent highway. The hourly PM 2.5 measurements were grouped into observations linked to SSW-WSW wind direction to model emissions downwind of the factory smokestack (T. Gentile, Personal Communications). For missing data or no wind direction (still), the nearest observation replaced the missing data point.
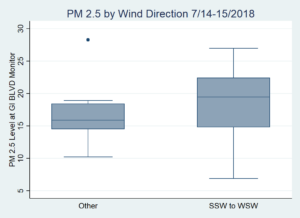
The average PM 2.5 concentration for SSW-WSW wind direction was 18.61 ug/m3 (SD=5.32, 95% CI=16.46-20.76). The average PM 2.5 concentration for other wind directions was 16.30 ug/m3 (SD=3.47, 95% CI=14.76-17.85) (see Figure 3). The average difference was 2.30 ug/m3, with higher levels and variability when the wind direction at the monitor came from the smokestack. No wind speed were recorded above 13 mph.
There is no known “safe” level of particulate matter for human health. The World Health Organization and American Thoracic Society’s recommended levels for 24-hour exposure are 25 ug/m3. The US Environmental Protection Agency’s levels are higher at 35 ug/m3. The levels observed in this brief were not outside of standard regulatory compliance levels, but may still be linked to deleterious health effects in sensitive individuals.
These results indicate that the particulate matter exposure was increased downwind of the pictured smokestack during the two-day measurement period. As an initial screening exercise, the methods and results flag the need for additional measurement and attention to these environmental exposures. This method should be replicated with larger datasets and validated data to confirm. Note that the facility is located in an area with a major motor vehicle highway, additional industrial facilities, and marine vessel traffic. This methods brief is meant to communicate one way in which to use publicly available data to enhance community capacity, and the number of observations is thus limited and specific inferences should not be drawn. However, the information can be used to initiate conversations about the need for additional and prioritized exposure measurement data.

